NOAA: March 2016 Was the Most Abnormally Warm Month on Record.

Data released on Thursday shows that March 2016 was the warmest March since at least 1891, making it the planet's 11th consecutive month to set a global temperature milestone. Scientists are witnessing the effects of climate change. The global average surface temperature in March was 0.62 degrees Celsius, or 1.16 degrees Fahrenheit, above the 1981-2010 average. When measured against the 20th century average, the month looks even more unusual, at 1.07 degrees Celsius, or 1.9 degrees Fahrenheit, above average. March 2016 follows the most two most unusually warm months on record, which occurred in January and February. 


NOAA reports that March 2016 Was the Most Abnormally Warm Month on Record For the Planet, ever.

Alaska, Canada, Greenland, Central Siberia, and the Urals all experienced the most abnormally warm March, with temperatures 4 to 6 degrees Celsius above the average. In the Arctic, Greenland commenced its melt season more than one month early with temperatures skyrocketing into 60 degrees Fahrenheit in southwest Greenland and breaking records all the way to the top of the ice sheet itself, more than 10,000 feet above sea level. 

Earth's global temperatures in March 2016 were the most abnormally warm on record for any month, according to NOAA. This is the second month in a row that this remarkable feat has occurred. March 2016 is also the eleventh consecutive month in a row that the earth has recorded its warmest respective month on record. In addition to NOAA, three other agencies confirmed that this past March was the warmest on record. The Japan Meteorological Agency (JMA) calculated the global mean March 2016 temperature was 0.62 degrees Celsius (about 1.1 degrees Fahrenheit) above the March 30-year average from 1981-2010. A second analysis from NASA's Goddard Institute for Space Studies also concluded March anomalies were the highest in their period of record dating to 1880, a whopping 1.28 degrees Celsius above the 1951-1980 average period. NASA found the March 2016 anomaly crushed the previous March record by over 0.3 degrees. NOAA's global State of the Climate report released Tuesday found March's temperature over the Earth's surface was 1.22 degrees Celsius above the 20th century average, not only crushing the warmest March in the 137-year period of record set just one year prior, but also the largest temperature anomaly of any month in NOAA's database dating to 1880.

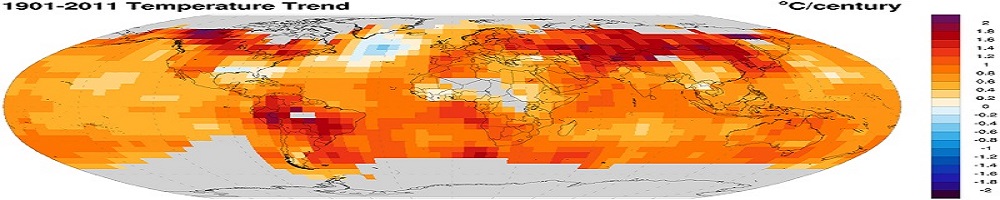
Whether one looks at a 12-month running average, 5-year average, or 30-year trends, all show stark increases in global average surface temperatures, which scientists have concluded is largely attributable to human-caused greenhouse gas emissions from the burning of fossil fuels.


Greenland is experiencing a early spring thaw.


The 2012 melt season, according to the National Snow and Ice Data Center, experienced melting even at mountainous heights over a mile into the sky atop Greenland. “During a peak melt event in July, even the summit areas of the ice sheet, nearly two miles above sea level, saw snowmelt conditions,” the group wrote. “While this has been observed in ice cores a handful of times in the past 1,000 years, it had not previously occurred in this century.” That’s not normal. 


A vast region of Greenland is experiencing a freakishly early spring thaw. Summer-like temperatures—a balmy 10 degrees Celsius (50 degrees Fahrenheit)—have created a melt area encompassing 12 percent of the planet’s northernmost ice sheet, according to analysis by the Danish Meteorological Institute (DMI). 
Almost 12% of Greenland’s ice sheet was melting on Monday, according to data crunched by the Danish Meteorological Institute. It beat by almost a month the previous record for a melt of more than 10%, on 5 May 2010.

“We had to check that our models were still working properly,”6 Peter Langen, climate scientist at DMI, told blog Polar Portal. Temperature readings on the ice were in line with the numbers, however, exceeding 10C in some places. Even a weather station 1840 metres above sea level recorded a maximum of 3.1C, which data analysts said would be warm for July, let alone April. Greenland’s usual melt season runs from early June to September. “Too much. Too early,” tweeted the World Meteorological Organisation.

Widespread melting on the Greenland ice sheet typically doesn’t get going until May. In fact, the three earliest dates for a melt area exceeding 10 percent are May 5, 2010, May 8, 1990, and May 8, 2006. “It is a very unusual situation, especially so early in the year,” climate scientist Martin Stendel said in a blog post, adding that cold air and low pressure systems to the east and west of Greenland have forced a warm air “cap” over the island.

Researchers attributed the surprising early melt this year to weather conditions, and more specifically, a warm midlatitude air mass getting stuck over the ice sheet. “The strong south air flow onto Greenland has produced warm air, rain instead of snow, and melting of snow that is in Nuuk,” Greenland’s capital, Jason Box, a researcher with the Geological Survey of Denmark and Greenland, said by email. So, what’ll happen to all that meltwater swimming atop of the ice sheet this week? In all likelihood, temperatures will soon drop, and it’ll percolate into the snow and refreeze, meteorologist Ruth Mottram of the DMI told New Scientist. But by doing so, the meltwater will carry heat energy to lower depths, reducing the amount required to thaw the ice out later. And if past years are any indicator, Greenland is in for another hot, melty summer.

In other words, time to bust out your rain boots if you live in Miami.

Contribution of Antarctica to past and future sea-level rise.

Polar temperatures over the last several million years have, at times, been slightly warmer than today, yet global mean sea level has been 6–9 metres higher as recently as the Last Interglacial (130,000 to 115,000 years ago) and possibly higher during the Pliocene epoch (about three million years ago). In both cases the Antarctic ice sheet has been implicated as the primary contributor, hinting at its future vulnerability.


 Here we use a model coupling ice sheet and climate dynamics—including previously underappreciated processes linking atmospheric warming with hydrofracturing of buttressing ice shelves and structural collapse of marine-terminating ice cliffs—that is calibrated against Pliocene and Last Interglacial sea-level estimates and applied to future greenhouse gas emission scenarios. Antarctica has the potential to contribute more than a metre of sea-level rise by 2100 and more than 15 metres by 2500, if emissions continue unabated. In this case atmospheric warming will soon become the dominant driver of ice loss, but prolonged ocean warming will delay its recovery for thousands of years.


If we use numerical climate simulations, paleoclimate data, and modern observations to study the effect of growing ice melt from Antarctica and Greenland. 

 We hypothesize that ice mass loss from the most vulnerable ice, sufficient to raise sea level several meters, is better approximated as exponential than by a more linear response. Doubling times of 10, 20 or 40 years yield multi-meter sea level rise in about 50, 100 or 200 years. Recent ice melt doubling times are near the lower end of the 10–40-year range, but the record is too short to confirm the nature of the response. 

The feedbacks, including subsurface ocean warming, help explain paleoclimate data and point to a dominant Southern Ocean role in controlling atmospheric CO2, which in turn exercised tight control on global temperature and sea level. The millennial (500–2000-year) timescale of deep-ocean ventilation affects the timescale for natural CO2 change and thus the timescale for paleo-global climate, ice sheet, and sea level changes, but this paleo-millennial timescale should not be misinterpreted as the timescale for ice sheet response to a rapid, large, human-made climate forcing. These climate feedbacks aid interpretation of events late in the prior interglacial, when sea level rose to +6–9 m with evidence of extreme storms while Earth was less than 1 °C warmer than today. Ice melt cooling of the North Atlantic and Southern oceans increases atmospheric temperature gradients, eddy kinetic energy and baroclinicity, thus driving more powerful storms. The modeling, paleoclimate evidence, and ongoing observations together imply that 2 °C global warming above the preindustrial level could be dangerous. Continued high fossil fuel emissions this century are predicted to yield (1) cooling of the Southern Ocean, especially in the Western Hemisphere; (2) slowing of the Southern Ocean overturning circulation, warming of the ice shelves, and growing ice sheet mass loss; (3) slowdown and eventual shutdown of the Atlantic overturning circulation with cooling of the North Atlantic region; (4) increasingly powerful storms; and (5) nonlinearly growing sea level rise, reaching several meters over a timescale of 50–150 years. These predictions, especially the cooling in the Southern Ocean and North Atlantic with markedly reduced warming or even cooling in Europe, differ fundamentally from existing climate change assessments. We discuss observations and modeling studies needed to refute or clarify these assertions.

Meltwater tends to stabilize the ocean column, inducing amplifying feedbacks that increase subsurface ocean warming and ice shelf melting. Cold meltwater and induced dynamical effects cause ocean surface cooling in the Southern Ocean and North Atlantic, thus increasing Earth's energy imbalance and heat flux into most of the global ocean's surface. Southern Ocean surface cooling, while lower latitudes are warming, increases precipitation on the Southern Ocean, increasing ocean stratification, slowing deepwater formation, and increasing ice sheet mass loss. These feedbacks make ice sheets in contact with the ocean vulnerable to accelerating disintegration